
In dynasty fantasy football, running back is the position where age matters most. The window opens fast, closes faster, and the cliff comes with almost no warning. Understanding when that window opens and closes is the difference between selling at peak value and watching an asset crater on your roster.
In this study, we’ll examine the peak age for NFL running backs using PPR scoring data since 2000—across multiple performance thresholds and eras—to identify exactly when dynasty managers should be buying, holding, and selling.
Estimated Reading Time: 6 minutes
TL;DR:
- The average peak RB season occurs at age 25.5—nearly 1.5 years younger than wide receivers
- F93% of peak seasons since 2010 happen before age 29
- No running back age 33 or older has qualified since 2000
- 39% of qualifying RBs hit this threshold in only one season
- Since 2016, the average peak age has dropped to 24.8
Dynasty takeaway: The sell window for running backs is 25–26 or earlier. If you’re waiting until 27-28, you’re probably already late.
Defining a Peak Season
To study when running backs peak, we need a clear threshold. We’ll use 15 PPR points per game with a minimum of seven games played. Roughly 12 running backs per year clear this bar, making it an effective proxy for RB1 production.
The complete dataset includes 343 individual seasons since 2000, compiled using data from Pro-Football-Reference.com.
| Player | Season | Age | Team | G | PPR | PPR/G |
|---|---|---|---|---|---|---|
| Marshall Faulk | 2000 | 27 | STL | 14 | 459.9 | 32.85 |
| Priest Holmes | 2002 | 29 | KAN | 14 | 440.7 | 31.48 |
| LaDainian Tomlinson | 2006 | 27 | SDG | 16 | 481.1 | 30.07 |
| Marshall Faulk | 2001 | 28 | STL | 14 | 419.7 | 29.98 |
| Christian McCaffrey | 2019 | 23 | CAR | 16 | 471.2 | 29.45 |
| Priest Holmes | 2003 | 30 | KAN | 16 | 445 | 27.81 |
| LaDainian Tomlinson | 2003 | 24 | SDG | 16 | 443.8 | 27.74 |
| Priest Holmes | 2004 | 31 | KAN | 8 | 212.9 | 26.61 |
| Todd Gurley | 2018 | 24 | LAR | 14 | 372.1 | 26.58 |
| Le'Veon Bell | 2016 | 24 | PIT | 12 | 317.4 | 26.45 |
| Steven Jackson | 2006 | 23 | STL | 16 | 415.4 | 25.96 |
| Todd Gurley | 2017 | 23 | LAR | 15 | 383.3 | 25.55 |
| David Johnson | 2016 | 25 | ARI | 16 | 407.8 | 25.49 |
| Jamaal Charles | 2013 | 27 | KAN | 15 | 378 | 25.2 |
| Alvin Kamara | 2020 | 25 | NOR | 15 | 377.8 | 25.19 |
| Edgerrin James | 2000 | 22 | IND | 16 | 395.3 | 24.71 |
| Chris Johnson | 2009 | 24 | TEN | 16 | 392.9 | 24.56 |
| Brian Westbrook | 2007 | 28 | PHI | 15 | 368.4 | 24.56 |
| Christian McCaffrey | 2025 | 29 | SFO | 17 | 416.6 | 24.51 |
| Arian Foster | 2010 | 24 | HOU | 16 | 392 | 24.5 |
| Christian McCaffrey | 2023 | 27 | SFO | 16 | 391.3 | 24.46 |
| Ronnie Brown | 2007 | 26 | MIA | 7 | 170.1 | 24.3 |
| Derrick Henry | 2021 | 27 | TEN | 8 | 193.3 | 24.16 |
| Dalvin Cook | 2020 | 25 | MIN | 14 | 337.8 | 24.13 |
| Saquon Barkley | 2018 | 21 | NYG | 16 | 385.8 | 24.11 |
| Christian McCaffrey | 2018 | 22 | CAR | 16 | 385.5 | 24.09 |
| Ahman Green | 2003 | 26 | GNB | 16 | 385 | 24.06 |
| Clinton Portis | 2003 | 22 | DEN | 13 | 312.5 | 24.04 |
| LaDainian Tomlinson | 2002 | 23 | SDG | 16 | 384.2 | 24.01 |
| Alvin Kamara | 2018 | 23 | NOR | 15 | 354.2 | 23.61 |
| Shaun Alexander | 2005 | 28 | SEA | 16 | 376.8 | 23.55 |
| Arian Foster | 2011 | 25 | HOU | 13 | 305.1 | 23.47 |
| Ricky Williams | 2000 | 23 | NOR | 10 | 234.3 | 23.43 |
| Ray Rice | 2011 | 24 | BAL | 16 | 372.8 | 23.3 |
| Larry Johnson | 2006 | 27 | KAN | 16 | 370.9 | 23.18 |
| Le'Veon Bell | 2014 | 22 | PIT | 16 | 370.5 | 23.16 |
| LaDainian Tomlinson | 2007 | 28 | SDG | 16 | 367.6 | 22.98 |
| Melvin Gordon | 2018 | 25 | LAC | 12 | 275.5 | 22.96 |
| LaDainian Tomlinson | 2005 | 26 | SDG | 16 | 366.1 | 22.88 |
| Le'Veon Bell | 2017 | 25 | PIT | 15 | 341.6 | 22.77 |
| Ricky Williams | 2002 | 25 | MIA | 16 | 362.6 | 22.66 |
| Larry Johnson | 2005 | 26 | KAN | 16 | 360.3 | 22.52 |
| Tiki Barber | 2005 | 30 | NYG | 16 | 359 | 22.44 |
| LaDainian Tomlinson | 2004 | 25 | SDG | 15 | 336.1 | 22.41 |
| Saquon Barkley | 2024 | 27 | PHI | 16 | 355.3 | 22.21 |
| Brian Westbrook | 2006 | 27 | PHI | 15 | 330.6 | 22.04 |
| Jonathan Taylor | 2021 | 22 | IND | 17 | 373.1 | 21.95 |
| DeMarco Murray | 2014 | 26 | DAL | 16 | 351.1 | 21.94 |
| Ezekiel Elliott | 2018 | 23 | DAL | 15 | 329.1 | 21.94 |
| Austin Ekeler | 2022 | 27 | LAC | 17 | 372.7 | 21.92 |
| LeSean McCoy | 2011 | 23 | PHI | 15 | 328.4 | 21.89 |
| Bijan Robinson | 2025 | 23 | ATL | 17 | 370.8 | 21.81 |
| Tiki Barber | 2004 | 29 | NYG | 16 | 347.6 | 21.73 |
| Adrian Peterson | 2012 | 27 | MIN | 16 | 347.4 | 21.71 |
| Charlie Garner | 2002 | 30 | OAK | 16 | 347.3 | 21.71 |
| Ezekiel Elliott | 2016 | 21 | DAL | 15 | 325.4 | 21.69 |
| Matt Forte | 2014 | 29 | CHI | 16 | 346.6 | 21.66 |
| Jahmyr Gibbs | 2025 | 23 | DET | 17 | 366.9 | 21.58 |
| Domanick Williams | 2004 | 24 | HOU | 15 | 323.6 | 21.57 |
| James Conner | 2018 | 23 | PIT | 13 | 280 | 21.54 |
| Fred Taylor | 2000 | 24 | JAX | 13 | 279.9 | 21.53 |
| Austin Ekeler | 2021 | 26 | LAC | 16 | 343.8 | 21.49 |
| Jahmyr Gibbs | 2024 | 22 | DET | 17 | 362.9 | 21.35 |
| Jonathan Taylor | 2025 | 26 | IND | 17 | 362.3 | 21.31 |
| Brian Westbrook | 2004 | 25 | PHI | 13 | 276.5 | 21.27 |
| Kyren Williams | 2023 | 23 | LAR | 12 | 255 | 21.25 |
| Devonta Freeman | 2015 | 23 | ATL | 15 | 316.4 | 21.09 |
| Matt Forte | 2013 | 28 | CHI | 16 | 337.3 | 21.08 |
| LaMont Jordan | 2005 | 27 | OAK | 14 | 294.8 | 21.06 |
| Arian Foster | 2014 | 28 | HOU | 13 | 273.5 | 21.04 |
| Christian McCaffrey | 2022 | 26 | CAR,SFO | 17 | 356.4 | 20.96 |
| Kareem Hunt | 2018 | 23 | KAN | 11 | 230.2 | 20.93 |
| Eddie George | 2000 | 27 | TEN | 16 | 334.2 | 20.89 |
| Dalvin Cook | 2019 | 24 | MIN | 14 | 292.4 | 20.89 |
| Fred Jackson | 2011 | 30 | BUF | 10 | 208.6 | 20.86 |
| Derrick Henry | 2020 | 26 | TEN | 16 | 333.1 | 20.82 |
| Priest Holmes | 2001 | 28 | KAN | 16 | 332.9 | 20.81 |
| Deuce McAllister | 2002 | 24 | NOR | 15 | 311 | 20.73 |
| Edgerrin James | 2005 | 27 | IND | 15 | 310.3 | 20.69 |
| LeSean McCoy | 2013 | 25 | PHI | 16 | 330.6 | 20.66 |
| Darren McFadden | 2010 | 23 | OAK | 13 | 267.4 | 20.57 |
| Shaun Alexander | 2002 | 25 | SEA | 16 | 328.5 | 20.53 |
| Edgerrin James | 2003 | 25 | IND | 13 | 266.1 | 20.47 |
| Deuce McAllister | 2003 | 25 | NOR | 16 | 326.7 | 20.42 |
| Ray Rice | 2009 | 22 | BAL | 16 | 326.1 | 20.38 |
| Jamal Lewis | 2003 | 24 | BAL | 16 | 325.1 | 20.32 |
| Ezekiel Elliott | 2017 | 22 | DAL | 10 | 203.2 | 20.32 |
| Shaun Alexander | 2004 | 27 | SEA | 16 | 323.6 | 20.23 |
| Maurice Jones-Drew | 2009 | 24 | JAX | 16 | 323.5 | 20.22 |
| Marshall Faulk | 2002 | 29 | STL | 14 | 283 | 20.21 |
| Frank Gore | 2006 | 23 | SFO | 16 | 323 | 20.19 |
| De'Von Achane | 2025 | 24 | MIA | 16 | 322.8 | 20.18 |
| Marshall Faulk | 2003 | 30 | STL | 11 | 221.8 | 20.16 |
| Bijan Robinson | 2024 | 22 | ATL | 17 | 341.7 | 20.1 |
| Tiki Barber | 2002 | 27 | NYG | 16 | 321.4 | 20.09 |
| Adrian Peterson | 2009 | 24 | MIN | 16 | 320.9 | 20.06 |
| Alvin Kamara | 2017 | 22 | NOR | 16 | 320.4 | 20.03 |
| Curtis Martin | 2004 | 31 | NYJ | 16 | 319.2 | 19.95 |
| Frank Gore | 2009 | 26 | SFO | 14 | 278.6 | 19.9 |
| LeSean McCoy | 2016 | 28 | BUF | 15 | 298.3 | 19.89 |
| Ahman Green | 2001 | 24 | GNB | 16 | 318.1 | 19.88 |
| LeSean McCoy | 2010 | 22 | PHI | 15 | 297.2 | 19.81 |
| Derrick Henry | 2024 | 30 | BAL | 17 | 336.4 | 19.79 |
| Ahman Green | 2000 | 23 | GNB | 16 | 316.4 | 19.78 |
| Clinton Portis | 2002 | 21 | DEN | 16 | 316.2 | 19.76 |
| Aaron Jones | 2019 | 25 | GNB | 16 | 314.8 | 19.68 |
| Derrick Henry | 2019 | 25 | TEN | 15 | 294.6 | 19.64 |
| Ezekiel Elliott | 2019 | 24 | DAL | 16 | 311.7 | 19.48 |
| Doug Martin | 2012 | 23 | TAM | 16 | 311.6 | 19.48 |
| Josh Jacobs | 2022 | 24 | LVR | 17 | 328.3 | 19.31 |
| Austin Ekeler | 2019 | 24 | LAC | 16 | 309 | 19.31 |
| Melvin Gordon | 2016 | 23 | SDG | 13 | 250.6 | 19.28 |
| Brian Westbrook | 2008 | 29 | PHI | 14 | 269.8 | 19.27 |
| Curtis Martin | 2000 | 27 | NYJ | 16 | 307.9 | 19.24 |
| DeAngelo Williams | 2008 | 25 | CAR | 16 | 307.6 | 19.23 |
| Ahman Green | 2002 | 25 | GNB | 14 | 268.3 | 19.16 |
| Edgerrin James | 2004 | 26 | IND | 16 | 306.1 | 19.13 |
| Shaun Alexander | 2003 | 26 | SEA | 16 | 305 | 19.06 |
| Maurice Jones-Drew | 2011 | 26 | JAX | 16 | 305 | 19.06 |
| Matt Forte | 2008 | 23 | CHI | 16 | 304.5 | 19.03 |
| Brian Westbrook | 2005 | 26 | PHI | 12 | 228.3 | 19.03 |
| Alvin Kamara | 2024 | 29 | NOR | 14 | 265.3 | 18.95 |
| Derrick Henry | 2022 | 28 | TEN | 16 | 302.8 | 18.93 |
| Marshawn Lynch | 2014 | 28 | SEA | 16 | 302.3 | 18.89 |
| Arian Foster | 2012 | 26 | HOU | 16 | 302.1 | 18.88 |
| Charlie Garner | 2000 | 28 | SFO | 16 | 300.9 | 18.81 |
| Saquon Barkley | 2019 | 22 | NYG | 13 | 244.1 | 18.78 |
| Steven Jackson | 2008 | 25 | STL | 12 | 224.1 | 18.68 |
| Tiki Barber | 2006 | 31 | NYG | 16 | 298.7 | 18.67 |
| Ricky Watters | 2000 | 31 | SEA | 16 | 298.5 | 18.66 |
| Reggie Bush | 2008 | 23 | NOR | 10 | 186.4 | 18.64 |
| Shaun Alexander | 2001 | 24 | SEA | 16 | 298.1 | 18.63 |
| Domanick Williams | 2005 | 25 | HOU | 11 | 204.3 | 18.57 |
| Curtis Martin | 2001 | 28 | NYJ | 16 | 297 | 18.56 |
| Knowshon Moreno | 2013 | 26 | DEN | 16 | 296.6 | 18.54 |
| Aaron Jones | 2020 | 26 | GNB | 14 | 258.9 | 18.49 |
| Kareem Hunt | 2017 | 22 | KAN | 16 | 295.2 | 18.45 |
| Joseph Addai | 2007 | 24 | IND | 15 | 276.6 | 18.44 |
| DeMarco Murray | 2013 | 25 | DAL | 14 | 258.1 | 18.44 |
| Peyton Hillis | 2010 | 24 | CLE | 16 | 294.9 | 18.43 |
| Frank Gore | 2010 | 27 | SFO | 11 | 202.5 | 18.41 |
| Adrian Peterson | 2010 | 25 | MIN | 15 | 275.9 | 18.39 |
| Matt Forte | 2011 | 26 | CHI | 12 | 220.7 | 18.39 |
| DeMarco Murray | 2016 | 28 | TEN | 16 | 293.8 | 18.36 |
| Kevin Jones | 2006 | 24 | DET | 12 | 219.9 | 18.33 |
| Leonard Fournette | 2021 | 26 | TAM | 14 | 255.6 | 18.26 |
| Priest Holmes | 2005 | 32 | KAN | 7 | 127.8 | 18.26 |
| Julius Jones | 2004 | 23 | DAL | 8 | 145.8 | 18.23 |
| Christian McCaffrey | 2021 | 25 | CAR | 7 | 127.5 | 18.21 |
| Tiki Barber | 2000 | 25 | NYG | 16 | 290.5 | 18.16 |
| Alvin Kamara | 2021 | 26 | NOR | 13 | 234.7 | 18.05 |
| Willie Parker | 2006 | 26 | PIT | 16 | 288.6 | 18.04 |
| Melvin Gordon | 2017 | 24 | LAC | 16 | 288.1 | 18.01 |
| Joe Mixon | 2021 | 25 | CIN | 16 | 287.9 | 17.99 |
| Adrian Peterson | 2007 | 22 | MIN | 14 | 251.9 | 17.99 |
| Alvin Kamara | 2023 | 28 | NOR | 13 | 233 | 17.92 |
| James Robinson | 2020 | 22 | JAX | 14 | 250.4 | 17.89 |
| Raheem Mostert | 2023 | 31 | MIA | 15 | 267.7 | 17.85 |
| James Cook | 2025 | 26 | BUF | 17 | 302.2 | 17.78 |
| Devonta Freeman | 2016 | 24 | ATL | 16 | 284.1 | 17.76 |
| Saquon Barkley | 2022 | 25 | NYG | 16 | 284 | 17.75 |
| Alvin Kamara | 2019 | 24 | NOR | 14 | 248.5 | 17.75 |
| Travis Henry | 2002 | 24 | BUF | 16 | 283.7 | 17.73 |
| Leonard Fournette | 2017 | 22 | JAX | 13 | 230.2 | 17.71 |
| Najee Harris | 2021 | 23 | PIT | 17 | 300.7 | 17.69 |
| Ray Rice | 2012 | 25 | BAL | 16 | 283.1 | 17.69 |
| Darren McFadden | 2011 | 24 | OAK | 7 | 123.8 | 17.69 |
| Jamaal Charles | 2010 | 24 | KAN | 16 | 282.5 | 17.66 |
| David Montgomery | 2020 | 23 | CHI | 15 | 264.8 | 17.65 |
| De'Von Achane | 2024 | 23 | MIA | 17 | 299.9 | 17.64 |
| Maurice Jones-Drew | 2008 | 23 | JAX | 16 | 280.9 | 17.56 |
| Robert Smith | 2000 | 28 | MIN | 16 | 280.9 | 17.56 |
| Jonathan Taylor | 2024 | 25 | IND | 14 | 244.7 | 17.48 |
| Corey Dillon | 2004 | 30 | NWE | 15 | 260.8 | 17.39 |
| Joe Mixon | 2018 | 22 | CIN | 14 | 243.4 | 17.39 |
| Larry Johnson | 2004 | 25 | KAN | 10 | 173.9 | 17.39 |
| Mark Ingram | 2017 | 28 | NOR | 16 | 278 | 17.38 |
| Michael Turner | 2008 | 26 | ATL | 16 | 278 | 17.38 |
| Maurice Jones-Drew | 2006 | 21 | JAX | 16 | 277.7 | 17.36 |
| LaDainian Tomlinson | 2008 | 29 | SDG | 16 | 277.6 | 17.35 |
| De'Von Achane | 2023 | 22 | MIA | 11 | 190.7 | 17.34 |
| Darren Sproles | 2011 | 28 | NOR | 16 | 277.3 | 17.33 |
| Nick Chubb | 2020 | 25 | CLE | 12 | 207.7 | 17.31 |
| Ray Rice | 2010 | 23 | BAL | 16 | 276.6 | 17.29 |
| James White | 2018 | 26 | NWE | 16 | 276.6 | 17.29 |
| Leonard Fournette | 2019 | 24 | JAX | 15 | 259.4 | 17.29 |
| Fred Taylor | 2003 | 27 | JAX | 16 | 276.2 | 17.26 |
| Josh Jacobs | 2024 | 26 | GNB | 17 | 293.1 | 17.24 |
| Thomas Jones | 2008 | 30 | NYJ | 16 | 275.9 | 17.24 |
| Adrian Peterson | 2011 | 26 | MIN | 12 | 206.9 | 17.24 |
| Reggie Bush | 2007 | 22 | NOR | 12 | 206.8 | 17.23 |
| Marshawn Lynch | 2013 | 27 | SEA | 16 | 275.3 | 17.21 |
| James Conner | 2021 | 26 | ARI | 15 | 257.7 | 17.18 |
| Joe Mixon | 2024 | 28 | HOU | 14 | 240.5 | 17.18 |
| Dion Lewis | 2015 | 25 | NWE | 7 | 120.2 | 17.17 |
| Joe Mixon | 2022 | 26 | CIN | 14 | 239.5 | 17.11 |
| Breece Hall | 2023 | 22 | NYJ | 17 | 290.5 | 17.09 |
| Reggie Bush | 2013 | 28 | DET | 14 | 239.2 | 17.09 |
| Chris Johnson | 2010 | 25 | TEN | 16 | 272.9 | 17.06 |
| Clinton Portis | 2007 | 26 | WAS | 16 | 272.7 | 17.04 |
| Mike Anderson | 2000 | 27 | DEN | 16 | 272.6 | 17.04 |
| Eddie Lacy | 2014 | 24 | GNB | 16 | 272.6 | 17.04 |
| Ricky Williams | 2003 | 26 | MIA | 16 | 272.3 | 17.02 |
| Kyren Williams | 2024 | 24 | LAR | 16 | 272.1 | 17.01 |
| Tiki Barber | 2001 | 26 | NYG | 14 | 238.2 | 17.01 |
| Lamar Smith | 2000 | 30 | MIA | 15 | 255 | 17 |
| Clinton Portis | 2005 | 24 | WAS | 16 | 271.9 | 16.99 |
| Steve Slaton | 2008 | 22 | HOU | 16 | 271.9 | 16.99 |
| Trent Richardson | 2012 | 22 | CLE | 15 | 254.7 | 16.98 |
| Michael Pittman | 2004 | 29 | TAM | 13 | 220.7 | 16.98 |
| Mark Ingram | 2015 | 26 | NOR | 12 | 203.4 | 16.95 |
| Stephen Davis | 2000 | 26 | WAS | 15 | 254.1 | 16.94 |
| Ryan Mathews | 2011 | 24 | SDG | 14 | 236.6 | 16.9 |
| Marshawn Lynch | 2012 | 26 | SEA | 16 | 269.6 | 16.85 |
| Jonathan Taylor | 2020 | 21 | IND | 15 | 252.8 | 16.85 |
| LaDainian Tomlinson | 2001 | 22 | SDG | 16 | 269.3 | 16.83 |
| Shane Vereen | 2013 | 24 | NWE | 8 | 134.5 | 16.81 |
| Steven Jackson | 2007 | 24 | STL | 12 | 201.4 | 16.78 |
| Maurice Jones-Drew | 2010 | 25 | JAX | 14 | 234.1 | 16.72 |
| Fred Taylor | 2002 | 26 | JAX | 16 | 267.2 | 16.7 |
| Jamaal Charles | 2014 | 28 | KAN | 15 | 250.4 | 16.69 |
| Thomas Jones | 2004 | 26 | CHI | 14 | 233.5 | 16.68 |
| Le'Veon Bell | 2013 | 21 | PIT | 13 | 216.9 | 16.68 |
| Reggie Bush | 2006 | 21 | NOR | 16 | 266.7 | 16.67 |
| James Cook | 2024 | 25 | BUF | 16 | 266.7 | 16.67 |
| Chris Johnson | 2008 | 23 | TEN | 15 | 249.8 | 16.65 |
| Chase Brown | 2025 | 25 | CIN | 17 | 282.6 | 16.62 |
| Adrian Peterson | 2013 | 28 | MIN | 14 | 232.7 | 16.62 |
| Darren Sproles | 2012 | 29 | NOR | 13 | 216.1 | 16.62 |
| Travis Etienne | 2023 | 24 | JAX | 17 | 282.4 | 16.61 |
| LeSean McCoy | 2012 | 24 | PHI | 12 | 199.3 | 16.61 |
| Ricky Williams | 2001 | 24 | NOR | 16 | 265.6 | 16.6 |
| Nick Chubb | 2022 | 27 | CLE | 17 | 281.4 | 16.55 |
| Joseph Addai | 2009 | 26 | IND | 15 | 248.3 | 16.55 |
| Matt Forte | 2010 | 25 | CHI | 16 | 264.6 | 16.54 |
| Austin Ekeler | 2020 | 25 | LAC | 10 | 165.3 | 16.53 |
| Matt Forte | 2015 | 30 | CHI | 13 | 214.7 | 16.52 |
| Kevin Smith | 2011 | 25 | DET | 7 | 115.5 | 16.5 |
| LeSean McCoy | 2017 | 29 | BUF | 16 | 263.6 | 16.48 |
| Jamal Lewis | 2007 | 28 | CLE | 15 | 247.2 | 16.48 |
| Kenneth Walker III | 2024 | 24 | SEA | 11 | 181.2 | 16.47 |
| Derrick Henry | 2025 | 31 | BAL | 17 | 279.5 | 16.44 |
| Breece Hall | 2022 | 21 | NYJ | 7 | 115.1 | 16.44 |
| Frank Gore | 2008 | 25 | SFO | 14 | 229.9 | 16.42 |
| Myles Gaskin | 2020 | 23 | MIA | 10 | 164.2 | 16.42 |
| Adrian Peterson | 2008 | 23 | MIN | 16 | 261.5 | 16.34 |
| Steven Jackson | 2009 | 26 | STL | 15 | 244.8 | 16.32 |
| Adrian Peterson | 2015 | 30 | MIN | 16 | 260.7 | 16.29 |
| Eddie George | 2002 | 29 | TEN | 16 | 260 | 16.25 |
| Marshawn Lynch | 2011 | 25 | SEA | 15 | 243.6 | 16.24 |
| Domanick Williams | 2003 | 23 | HOU | 14 | 227.2 | 16.23 |
| Theo Riddick | 2016 | 25 | DET | 10 | 161.8 | 16.18 |
| Mark Ingram | 2019 | 30 | BAL | 15 | 242.5 | 16.17 |
| Eddie Lacy | 2013 | 23 | GNB | 15 | 242.5 | 16.17 |
| Corey Dillon | 2001 | 27 | CIN | 16 | 258.3 | 16.14 |
| Jahmyr Gibbs | 2023 | 21 | DET | 15 | 242.1 | 16.14 |
| Duce Staley | 2002 | 27 | PHI | 16 | 258 | 16.13 |
| Chuba Hubbard | 2024 | 25 | CAR | 15 | 241.6 | 16.11 |
| D'Andre Swift | 2021 | 22 | DET | 13 | 208.9 | 16.07 |
| Larry Johnson | 2007 | 28 | KAN | 8 | 128.5 | 16.06 |
| Ahmad Bradshaw | 2011 | 25 | NYG | 12 | 192.6 | 16.05 |
| Clinton Portis | 2006 | 25 | WAS | 8 | 128.3 | 16.04 |
| Todd Gurley | 2015 | 21 | STL | 13 | 208.4 | 16.03 |
| Duce Staley | 2001 | 26 | PHI | 13 | 208 | 16 |
| C.J. Spiller | 2012 | 25 | BUF | 16 | 255.3 | 15.96 |
| Cam Skattebo | 2025 | 23 | NYG | 8 | 127.7 | 15.96 |
| Nick Chubb | 2019 | 24 | CLE | 16 | 255.2 | 15.95 |
| Chase Brown | 2024 | 24 | CIN | 16 | 255 | 15.94 |
| Saquon Barkley | 2023 | 26 | NYG | 14 | 223.2 | 15.94 |
| Brandon Jacobs | 2008 | 26 | NYG | 13 | 206.5 | 15.88 |
| Dalvin Cook | 2021 | 26 | MIN | 13 | 206.3 | 15.87 |
| James Conner | 2024 | 29 | ARI | 16 | 253.8 | 15.86 |
| David Montgomery | 2024 | 27 | DET | 14 | 221.7 | 15.84 |
| Travis Henry | 2003 | 25 | BUF | 15 | 237.4 | 15.83 |
| Josh Jacobs | 2025 | 27 | GNB | 15 | 237.1 | 15.81 |
| Ahman Green | 2006 | 29 | GNB | 14 | 221.2 | 15.8 |
| Frank Gore | 2007 | 24 | SFO | 15 | 236.8 | 15.79 |
| Corey Dillon | 2005 | 31 | NWE | 12 | 189.4 | 15.78 |
| Rachaad White | 2023 | 24 | TAM | 17 | 267.9 | 15.76 |
| Derrick Ward | 2007 | 27 | NYG | 8 | 126.1 | 15.76 |
| Alfred Morris | 2012 | 24 | WAS | 16 | 252 | 15.75 |
| Jamal Lewis | 2002 | 23 | BAL | 16 | 251.9 | 15.74 |
| Warrick Dunn | 2000 | 25 | TAM | 16 | 251.5 | 15.72 |
| Joe Mixon | 2023 | 27 | CIN | 17 | 267 | 15.71 |
| Clinton Portis | 2004 | 23 | WAS | 15 | 235.6 | 15.71 |
| DeAngelo Williams | 2009 | 26 | CAR | 13 | 203.9 | 15.68 |
| Chris Carson | 2020 | 26 | SEA | 12 | 187.8 | 15.65 |
| Jonathan Taylor | 2023 | 24 | IND | 10 | 156.4 | 15.64 |
| Moe Williams | 2003 | 29 | MIN | 16 | 249.9 | 15.62 |
| Rudi Johnson | 2005 | 26 | CIN | 16 | 249.8 | 15.61 |
| Steven Jackson | 2005 | 22 | STL | 15 | 233.6 | 15.57 |
| Tony Pollard | 2022 | 25 | DAL | 16 | 248.8 | 15.55 |
| James Stewart | 2002 | 31 | DET | 14 | 217.4 | 15.53 |
| Chris Carson | 2019 | 25 | SEA | 15 | 232.6 | 15.51 |
| Marshawn Lynch | 2008 | 22 | BUF | 15 | 232.6 | 15.51 |
| James Conner | 2023 | 28 | ARI | 13 | 201.5 | 15.5 |
| Ronnie Brown | 2009 | 28 | MIA | 9 | 139.5 | 15.5 |
| Kyren Williams | 2025 | 25 | LAR | 17 | 263.3 | 15.49 |
| Ricky Williams | 2009 | 32 | MIA | 16 | 247.5 | 15.47 |
| Jamaal Charles | 2009 | 23 | KAN | 15 | 231.7 | 15.45 |
| Stephen Davis | 2003 | 29 | CAR | 14 | 216.3 | 15.45 |
| Ahmad Bradshaw | 2014 | 28 | IND | 10 | 154.5 | 15.45 |
| Justin Forsett | 2014 | 29 | BAL | 16 | 246.9 | 15.43 |
| Josh Jacobs | 2020 | 22 | LVR | 15 | 231.3 | 15.42 |
| Warrick Dunn | 2001 | 26 | TAM | 13 | 200.4 | 15.42 |
| David Johnson | 2018 | 27 | ARI | 16 | 246.6 | 15.41 |
| Clinton Portis | 2008 | 27 | WAS | 16 | 246.5 | 15.41 |
| James Conner | 2022 | 27 | ARI | 13 | 200.2 | 15.4 |
| Chris Brown | 2004 | 23 | TEN | 11 | 169.4 | 15.4 |
| Brandon Jacobs | 2007 | 25 | NYG | 11 | 169.3 | 15.39 |
| Nick Chubb | 2021 | 26 | CLE | 14 | 215.3 | 15.38 |
| Marion Barber III | 2008 | 25 | DAL | 15 | 230.2 | 15.35 |
| Jordan Howard | 2016 | 22 | CHI | 15 | 230.1 | 15.34 |
| James Stewart | 2000 | 29 | DET | 16 | 245.1 | 15.32 |
| Kenyan Drake | 2019 | 25 | ARI,MIA | 14 | 214.2 | 15.3 |
| Tiki Barber | 2003 | 28 | NYG | 16 | 244.7 | 15.29 |
| Earnest Graham | 2007 | 27 | TAM | 15 | 229.2 | 15.28 |
| Isiah Pacheco | 2023 | 24 | KAN | 14 | 213.9 | 15.28 |
| Aaron Jones | 2021 | 27 | GNB | 15 | 229 | 15.27 |
| Willis McGahee | 2007 | 26 | BAL | 15 | 228.8 | 15.25 |
| Ahman Green | 2004 | 27 | GNB | 15 | 228.6 | 15.24 |
| Warrick Dunn | 2002 | 27 | ATL | 15 | 228.4 | 15.23 |
| Danny Woodhead | 2015 | 30 | SDG | 16 | 243.1 | 15.19 |
| Javonte Williams | 2025 | 25 | DAL | 16 | 242.8 | 15.18 |
| Steven Jackson | 2010 | 27 | STL | 16 | 242.4 | 15.15 |
| Mark Ingram | 2016 | 27 | NOR | 16 | 242.2 | 15.14 |
| Chris Thompson | 2017 | 27 | WAS | 10 | 151.4 | 15.14 |
| Corey Dillon | 2002 | 28 | CIN | 16 | 241.9 | 15.12 |
| Marion Barber III | 2007 | 24 | DAL | 16 | 241.7 | 15.11 |
| Edgerrin James | 2002 | 24 | IND | 14 | 211.3 | 15.09 |
| Knowshon Moreno | 2010 | 23 | DEN | 13 | 196.1 | 15.08 |
| Omarion Hampton | 2025 | 22 | LAC | 9 | 135.7 | 15.08 |
| Josh Jacobs | 2021 | 23 | LVR | 15 | 226 | 15.07 |
| Melvin Gordon | 2019 | 26 | LAC | 12 | 180.8 | 15.07 |
| Warrick Dunn | 2003 | 28 | ATL | 11 | 165.8 | 15.07 |
| Rashard Mendenhall | 2010 | 23 | PIT | 16 | 241 | 15.06 |
| Breece Hall | 2024 | 23 | NYJ | 16 | 240.9 | 15.06 |
| Leonard Fournette | 2018 | 23 | JAX | 8 | 120.4 | 15.05 |
| Chris Johnson | 2013 | 28 | TEN | 16 | 240.2 | 15.01 |
| Deuce McAllister | 2004 | 26 | NOR | 14 | 210.2 | 15.01 |
| Thomas Jones | 2009 | 31 | NYJ | 16 | 240 | 15 |
| David Montgomery | 2021 | 24 | CHI | 13 | 195 | 15 |
| Elijah Mitchell | 2021 | 23 | SFO | 11 | 165 | 15 |
The average age across all qualifying seasons is 25.46. The distribution peaks at age 25 (53 seasons) and remains strong from 22–28, which accounts for 84.8% of all qualifying seasons.
Ten players accomplished the feat at just 21 years old: Clinton Portis, Maurice Jones-Drew, Reggie Bush, Le’Veon Bell, Todd Gurley, Saquon Barkley, Ezekiel Elliott, Jonathan Taylor, Breece Hall, and Jahmyr Gibbs. On the other end, only two players qualified at 32: Priest Holmes and Ricky Williams. No running back since 2000 has hit this threshold at 33 or older.
The drop-off after 28 is steep. While 8.7% of peak seasons occur at age 28, that number falls to just 5.2% at 29 and 3.8% at 30. By comparison, wide receivers maintain meaningful production well into their early 30s—running backs simply don’t.
Should 2000–2009 Be Included?
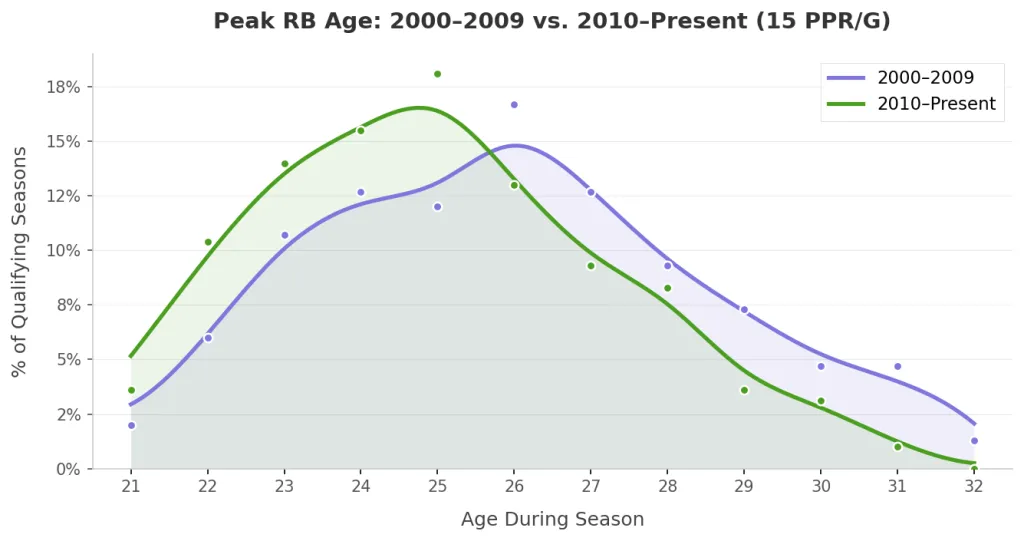
Each year I update this study, the peak age trends younger. The 2000s featured backs like Priest Holmes (ages 28–32), Marshall Faulk (27–30), and Tiki Barber (25–31) sustaining elite production deep into their late 20s and early 30s. That era looks nothing like today’s NFL.
Comparing the two eras at the 15 PPR/G threshold:
| 2000-09 | 2010-Present | |
| Qualifiers | 150 | 193 |
| Average Qualifiers Per Season | 15 | 12.1 |
| Average Age | 26.0 | 25.04 |
| Ages 21-28 | 82.0% | 92.2% |
| Age 29+ | 18.0% | 7.8% |
The average age dropped by nearly a full year. Qualifying running backs per season fell from 15 to 12, reflecting the league’s shift toward committee backfields and passing-game specialists. Most importantly, age 29+ seasons plummeted from 18% to 7.8%. The era of the productive 30-year-old back is essentially over.
Should 2010–2015 Be Included?
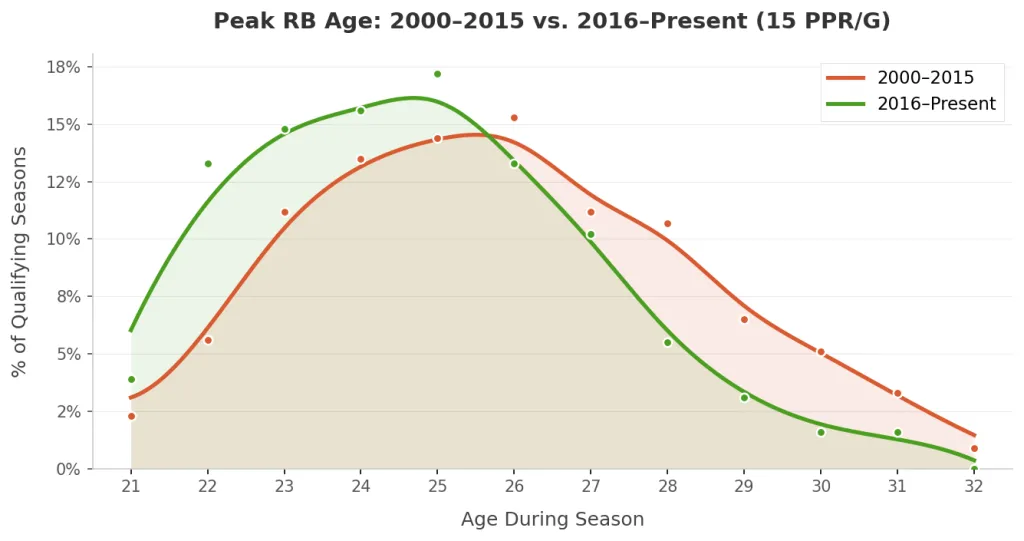
If the 2000s data looks outdated, the natural follow-up is whether the early 2010s still reflect today’s game. Isolating 2016–2025 pushes the trend further:
| 2000-15 | 2016-Present | |
| Qualifiers | 215 | 128 |
| Average Qualifiers Per Season | 13.4 | 12.8 |
| Average Age | 25.86 | 24.79 |
| Ages 21-28 | 73.5% | 93.8% |
| Age 29+ | 9.3% | 6.2% |
The average peak age dropped another full year to 24.79. Since 2016, 93.8% of peak seasons come from players aged 21–28. The age-29+ share sits at just 6.2%, and those seasons are dominated by a handful of outliers: Derrick Henry (ages 30–31), Christian McCaffrey (29), Alvin Kamara (29), and Raheem Mostert (31).
Notably, the 2010–2015 window (average age 25.52) isn’t dramatically different from 2016+ (24.79). The real outlier is clearly the 2000s. For most analytical purposes, including 2010–2015 in the modern dataset is reasonable.
The Elite Since 2010
Since the 2000s data skews the picture, let’s focus on 2010–present and raise the bar. At 17 PPR points per game, 115 seasons qualify—an average of 7.2 per year. These are true RB1 campaigns.
| Player | Season | Age | Team | G | PPR | PPR/G |
|---|---|---|---|---|---|---|
| Christian McCaffrey | 2019 | 23 | CAR | 16 | 471.2 | 29.45 |
| Todd Gurley | 2018 | 24 | LAR | 14 | 372.1 | 26.58 |
| Le'Veon Bell | 2016 | 24 | PIT | 12 | 317.4 | 26.45 |
| Todd Gurley | 2017 | 23 | LAR | 15 | 383.3 | 25.55 |
| David Johnson | 2016 | 25 | ARI | 16 | 407.8 | 25.49 |
| Jamaal Charles | 2013 | 27 | KAN | 15 | 378 | 25.2 |
| Alvin Kamara | 2020 | 25 | NOR | 15 | 377.8 | 25.19 |
| Christian McCaffrey | 2025 | 29 | SFO | 17 | 416.6 | 24.51 |
| Arian Foster | 2010 | 24 | HOU | 16 | 392 | 24.5 |
| Christian McCaffrey | 2023 | 27 | SFO | 16 | 391.3 | 24.46 |
| Derrick Henry | 2021 | 27 | TEN | 8 | 193.3 | 24.16 |
| Dalvin Cook | 2020 | 25 | MIN | 14 | 337.8 | 24.13 |
| Saquon Barkley | 2018 | 21 | NYG | 16 | 385.8 | 24.11 |
| Christian McCaffrey | 2018 | 22 | CAR | 16 | 385.5 | 24.09 |
| Alvin Kamara | 2018 | 23 | NOR | 15 | 354.2 | 23.61 |
| Arian Foster | 2011 | 25 | HOU | 13 | 305.1 | 23.47 |
| Ray Rice | 2011 | 24 | BAL | 16 | 372.8 | 23.3 |
| Le'Veon Bell | 2014 | 22 | PIT | 16 | 370.5 | 23.16 |
| Melvin Gordon | 2018 | 25 | LAC | 12 | 275.5 | 22.96 |
| Le'Veon Bell | 2017 | 25 | PIT | 15 | 341.6 | 22.77 |
| Saquon Barkley | 2024 | 27 | PHI | 16 | 355.3 | 22.21 |
| Jonathan Taylor | 2021 | 22 | IND | 17 | 373.1 | 21.95 |
| Ezekiel Elliott | 2018 | 23 | DAL | 15 | 329.1 | 21.94 |
| DeMarco Murray | 2014 | 26 | DAL | 16 | 351.1 | 21.94 |
| Austin Ekeler | 2022 | 27 | LAC | 17 | 372.7 | 21.92 |
| LeSean McCoy | 2011 | 23 | PHI | 15 | 328.4 | 21.89 |
| Bijan Robinson | 2025 | 23 | ATL | 17 | 370.8 | 21.81 |
| Adrian Peterson | 2012 | 27 | MIN | 16 | 347.4 | 21.71 |
| Ezekiel Elliott | 2016 | 21 | DAL | 15 | 325.4 | 21.69 |
| Matt Forte | 2014 | 29 | CHI | 16 | 346.6 | 21.66 |
| Jahmyr Gibbs | 2025 | 23 | DET | 17 | 366.9 | 21.58 |
| James Conner | 2018 | 23 | PIT | 13 | 280 | 21.54 |
| Austin Ekeler | 2021 | 26 | LAC | 16 | 343.8 | 21.49 |
| Jahmyr Gibbs | 2024 | 22 | DET | 17 | 362.9 | 21.35 |
| Jonathan Taylor | 2025 | 26 | IND | 17 | 362.3 | 21.31 |
| Kyren Williams | 2023 | 23 | LAR | 12 | 255 | 21.25 |
| Devonta Freeman | 2015 | 23 | ATL | 15 | 316.4 | 21.09 |
| Matt Forte | 2013 | 28 | CHI | 16 | 337.3 | 21.08 |
| Arian Foster | 2014 | 28 | HOU | 13 | 273.5 | 21.04 |
| Christian McCaffrey | 2022 | 26 | CAR,SFO | 17 | 356.4 | 20.96 |
| Kareem Hunt | 2018 | 23 | KAN | 11 | 230.2 | 20.93 |
| Dalvin Cook | 2019 | 24 | MIN | 14 | 292.4 | 20.89 |
| Fred Jackson | 2011 | 30 | BUF | 10 | 208.6 | 20.86 |
| Derrick Henry | 2020 | 26 | TEN | 16 | 333.1 | 20.82 |
| LeSean McCoy | 2013 | 25 | PHI | 16 | 330.6 | 20.66 |
| Darren McFadden | 2010 | 23 | OAK | 13 | 267.4 | 20.57 |
| Ezekiel Elliott | 2017 | 22 | DAL | 10 | 203.2 | 20.32 |
| De'Von Achane | 2025 | 24 | MIA | 16 | 322.8 | 20.18 |
| Bijan Robinson | 2024 | 22 | ATL | 17 | 341.7 | 20.1 |
| Alvin Kamara | 2017 | 22 | NOR | 16 | 320.4 | 20.03 |
| LeSean McCoy | 2016 | 28 | BUF | 15 | 298.3 | 19.89 |
| LeSean McCoy | 2010 | 22 | PHI | 15 | 297.2 | 19.81 |
| Derrick Henry | 2024 | 30 | BAL | 17 | 336.4 | 19.79 |
| Aaron Jones | 2019 | 25 | GNB | 16 | 314.8 | 19.68 |
| Derrick Henry | 2019 | 25 | TEN | 15 | 294.6 | 19.64 |
| Ezekiel Elliott | 2019 | 24 | DAL | 16 | 311.7 | 19.48 |
| Doug Martin | 2012 | 23 | TAM | 16 | 311.6 | 19.48 |
| Josh Jacobs | 2022 | 24 | LVR | 17 | 328.3 | 19.31 |
| Austin Ekeler | 2019 | 24 | LAC | 16 | 309 | 19.31 |
| Melvin Gordon | 2016 | 23 | SDG | 13 | 250.6 | 19.28 |
| Maurice Jones-Drew | 2011 | 26 | JAX | 16 | 305 | 19.06 |
| Alvin Kamara | 2024 | 29 | NOR | 14 | 265.3 | 18.95 |
| Derrick Henry | 2022 | 28 | TEN | 16 | 302.8 | 18.93 |
| Marshawn Lynch | 2014 | 28 | SEA | 16 | 302.3 | 18.89 |
| Arian Foster | 2012 | 26 | HOU | 16 | 302.1 | 18.88 |
| Saquon Barkley | 2019 | 22 | NYG | 13 | 244.1 | 18.78 |
| Knowshon Moreno | 2013 | 26 | DEN | 16 | 296.6 | 18.54 |
| Aaron Jones | 2020 | 26 | GNB | 14 | 258.9 | 18.49 |
| Kareem Hunt | 2017 | 22 | KAN | 16 | 295.2 | 18.45 |
| DeMarco Murray | 2013 | 25 | DAL | 14 | 258.1 | 18.44 |
| Peyton Hillis | 2010 | 24 | CLE | 16 | 294.9 | 18.43 |
| Frank Gore | 2010 | 27 | SFO | 11 | 202.5 | 18.41 |
| Matt Forte | 2011 | 26 | CHI | 12 | 220.7 | 18.39 |
| Adrian Peterson | 2010 | 25 | MIN | 15 | 275.9 | 18.39 |
| DeMarco Murray | 2016 | 28 | TEN | 16 | 293.8 | 18.36 |
| Leonard Fournette | 2021 | 26 | TAM | 14 | 255.6 | 18.26 |
| Christian McCaffrey | 2021 | 25 | CAR | 7 | 127.5 | 18.21 |
| Alvin Kamara | 2021 | 26 | NOR | 13 | 234.7 | 18.05 |
| Melvin Gordon | 2017 | 24 | LAC | 16 | 288.1 | 18.01 |
| Joe Mixon | 2021 | 25 | CIN | 16 | 287.9 | 17.99 |
| Alvin Kamara | 2023 | 28 | NOR | 13 | 233 | 17.92 |
| James Robinson | 2020 | 22 | JAX | 14 | 250.4 | 17.89 |
| Raheem Mostert | 2023 | 31 | MIA | 15 | 267.7 | 17.85 |
| James Cook | 2025 | 26 | BUF | 17 | 302.2 | 17.78 |
| Devonta Freeman | 2016 | 24 | ATL | 16 | 284.1 | 17.76 |
| Saquon Barkley | 2022 | 25 | NYG | 16 | 284 | 17.75 |
| Alvin Kamara | 2019 | 24 | NOR | 14 | 248.5 | 17.75 |
| Leonard Fournette | 2017 | 22 | JAX | 13 | 230.2 | 17.71 |
| Najee Harris | 2021 | 23 | PIT | 17 | 300.7 | 17.69 |
| Ray Rice | 2012 | 25 | BAL | 16 | 283.1 | 17.69 |
| Darren McFadden | 2011 | 24 | OAK | 7 | 123.8 | 17.69 |
| Jamaal Charles | 2010 | 24 | KAN | 16 | 282.5 | 17.66 |
| David Montgomery | 2020 | 23 | CHI | 15 | 264.8 | 17.65 |
| De'Von Achane | 2024 | 23 | MIA | 17 | 299.9 | 17.64 |
| Jonathan Taylor | 2024 | 25 | IND | 14 | 244.7 | 17.48 |
| Joe Mixon | 2018 | 22 | CIN | 14 | 243.4 | 17.39 |
| Mark Ingram | 2017 | 28 | NOR | 16 | 278 | 17.38 |
| De'Von Achane | 2023 | 22 | MIA | 11 | 190.7 | 17.34 |
| Darren Sproles | 2011 | 28 | NOR | 16 | 277.3 | 17.33 |
| Nick Chubb | 2020 | 25 | CLE | 12 | 207.7 | 17.31 |
| Leonard Fournette | 2019 | 24 | JAX | 15 | 259.4 | 17.29 |
| James White | 2018 | 26 | NWE | 16 | 276.6 | 17.29 |
| Ray Rice | 2010 | 23 | BAL | 16 | 276.6 | 17.29 |
| Josh Jacobs | 2024 | 26 | GNB | 17 | 293.1 | 17.24 |
| Adrian Peterson | 2011 | 26 | MIN | 12 | 206.9 | 17.24 |
| Marshawn Lynch | 2013 | 27 | SEA | 16 | 275.3 | 17.21 |
| Joe Mixon | 2024 | 28 | HOU | 14 | 240.5 | 17.18 |
| James Conner | 2021 | 26 | ARI | 15 | 257.7 | 17.18 |
| Dion Lewis | 2015 | 25 | NWE | 7 | 120.2 | 17.17 |
| Joe Mixon | 2022 | 26 | CIN | 14 | 239.5 | 17.11 |
| Breece Hall | 2023 | 22 | NYJ | 17 | 290.5 | 17.09 |
| Reggie Bush | 2013 | 28 | DET | 14 | 239.2 | 17.09 |
| Chris Johnson | 2010 | 25 | TEN | 16 | 272.9 | 17.06 |
| Eddie Lacy | 2014 | 24 | GNB | 16 | 272.6 | 17.04 |
| Kyren Williams | 2024 | 24 | LAR | 16 | 272.1 | 17.01 |
The average age of this group is 24.90. The 22–26 age range accounts for 76.5% of all qualifying seasons, and 94.8% occur before a player’s age-29 season.
Comparison Across Thresholds (2010–Present)
Stacking the scoring thresholds side by side reveals a consistent story:
| 15 PPR/G | 16 PPR/G | 17 PPR/G | 18 PPR/G | |
| Qualifiers | 193 | 150 | 115 | 79 |
| Average Qualifiers Per Season | 12.1 | 9.4 | 7.2 | 4.9 |
| Average Age | 25.04 | 24.95 | 24.90 | 24.86 |
| Ages 21-28 | 92.2% | 92.0% | 94.8% | 93.7% |
| Age 29+ | 7.8% | 8% | 5.2% | 6.3% |
Unlike wide receivers—where the average age dropped noticeably at higher thresholds—running backs show remarkable consistency. The average age barely moves between 15 and 18 PPR/G (25.04 → 24.86). The position simply peaks young regardless of the scoring bar. The age-29+ group shrinks at higher thresholds, but even at the baseline, it’s already tiny.
The takeaway is clear: when searching for elite production, running backs deliver it in their prime—typically before turning 27.
Running Backs vs. Wide Receivers
How does the RB aging curve compare to wide receivers? Using the same 15 PPR/G threshold since 2000:
- RB average peak age: 25.46 | WR average peak age: 26.95
- RBs peak 1.5 years earlier
- RB age 30+ seasons: 7.0% | WR age 30+ seasons: 21%
- Only 2 RBs qualified at 32+ vs. 37 WR seasons at 32+
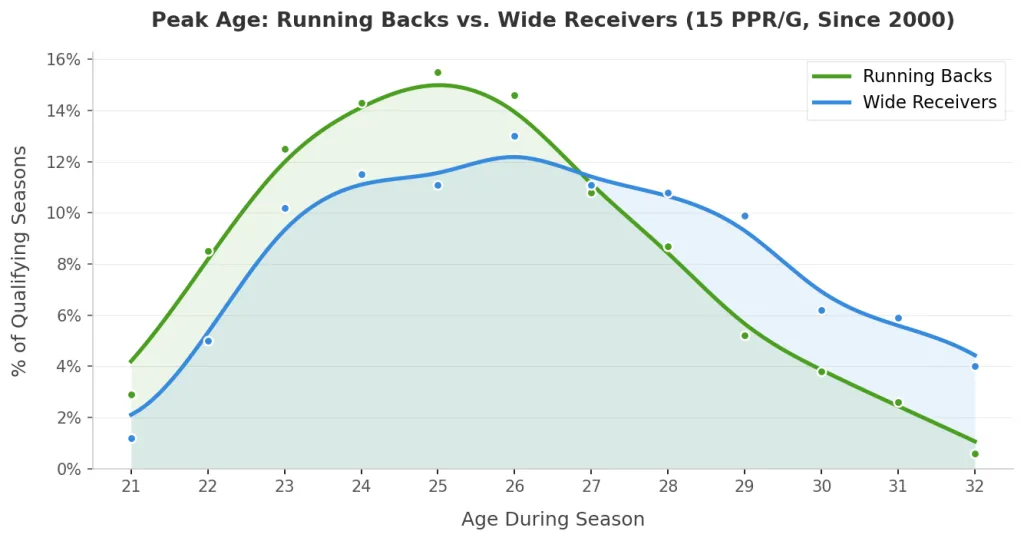
The RB curve peaks earlier, spikes higher, and collapses faster. While wide receivers can sustain value into their early 30s, the running back window is roughly 1.5 years shorter at every stage of the career arc. This has direct implications for dynasty trade strategy: the urgency to sell is greater, and the margin for error is smaller.
Career Longevity at Peak Level
One of the most underappreciated aspects of running back valuation is how short the peak window actually lasts for most players:
- 39% of qualifying RBs hit this threshold in just one season
- 57% manage two seasons or fewer
- Only 19% sustain peak production for five or more seasons
- The average age of a player’s last qualifying season is just 26.5
The typical dynasty window for an elite running back is 2–3 seasons, not 4–5. Players like LaDainian Tomlinson (8 qualifying seasons), Christian McCaffrey (7), and Alvin Kamara (7) are extreme outliers. Most backs flash for a season or two, then fall off the pace.
This means the market often overvalues running backs based on a single elite season. Dynasty managers should be cautious about paying premium prices for one-year breakouts, especially from backs already in their mid-20s.
Dynasty Implications
Across every threshold and era in this study, the data points to the same conclusion: running backs peak earlier, decline faster, and sustain elite production for fewer seasons than any other skill position.
- The sell window is 25–26 or earlier. This is the sweet spot where production and perceived value overlap. Once a back turns 27, the market starts pricing in decline—and the data says it should.
- Don’t pay for old running backs. Since 2010, fewer than 8% of peak seasons come from backs 29 or older. Since 2016, that number is 6.2%. The exceptions (Derrick Henry, CMC at 29) are generational talents, not a repeatable blueprint.
- One elite season doesn’t guarantee a second. With 39% of qualifying backs doing it only once, treat one-year breakouts with caution. Sell into the hype if you can get peak value.
- RBs depreciate faster than WRs—draft accordingly. Running backs peak 1.5 years earlier and have roughly half the career longevity at the top level. In dynasty startup drafts, this should inform how aggressively you target young backs vs. young receivers.
The smartest dynasty managers don’t just draft the right running backs—they sell them at the right time. The data says that time comes sooner than most expect.




My league: 12 team dynasty salary cap. Can start 2rb-3wr-1te-2 flex. I have Gurley and Kamara…I and have Lesean Mccoy but can trade him for the 1.11 pick. Should I keep him or take the 1.11?
You may be able to get a better value for him because of his name recognition but I certainly would advise trading him as he’s a declining asset.
Great job!!
This is great information. Thank you.